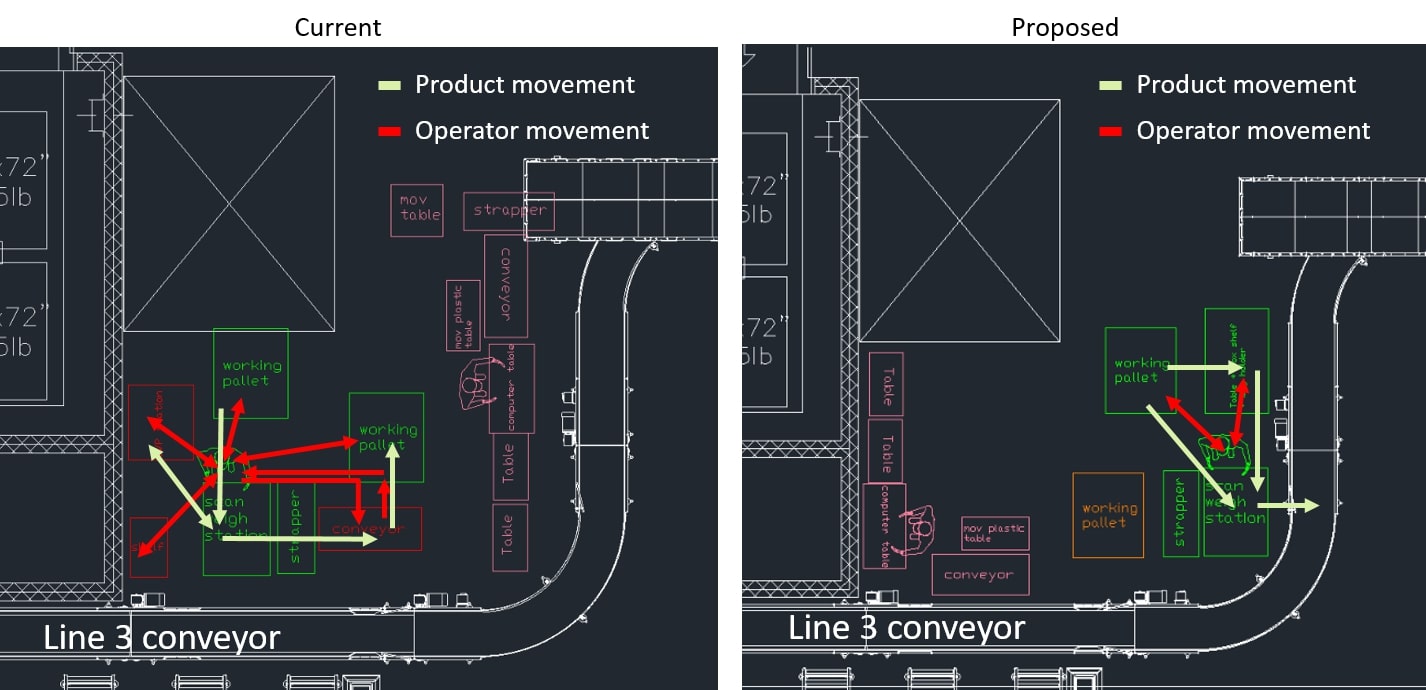
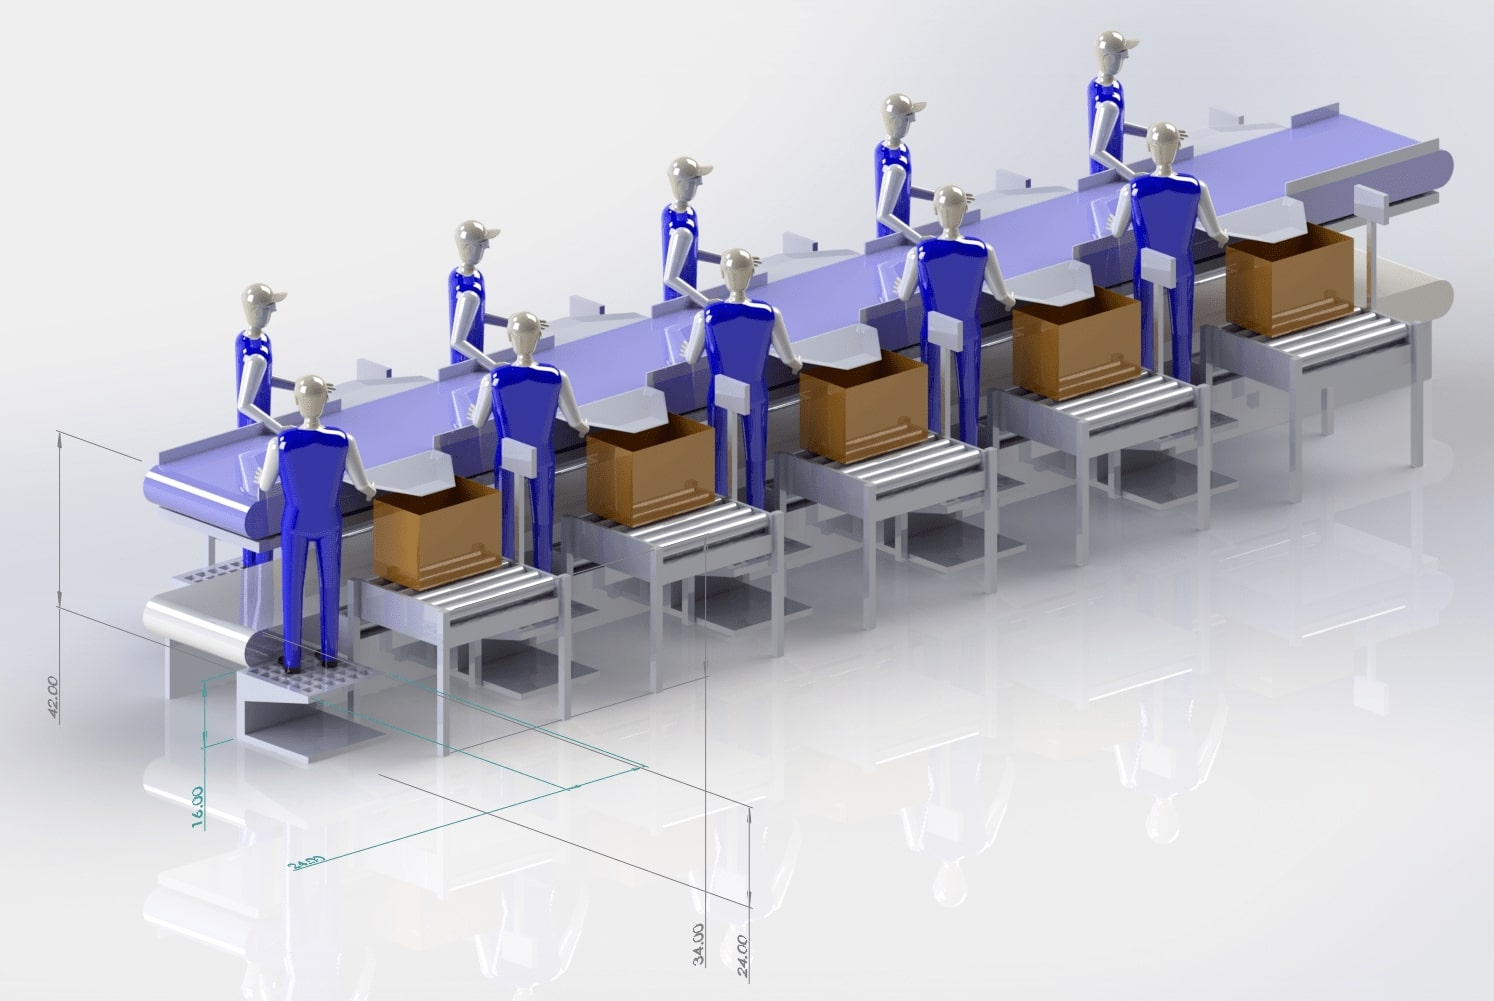
Butt and Loin Lines Merge Conveyors
At a previous job, merge conveyors between two different product ( butt and loin) lines posed several challenges, including the presence of foreign material and product pile-ups. I collaborated with the industrial engineer from the loin and packaging area and the continuous improvement manager to devise solutions for these issues.
- Measurement: I took measurements of conveyor lengths and product flow to enable a JavaScript simulation for determining optimal conveyor speeds to prevent product pile-ups.
- Simulation: I simulated layouts for several ideas, including a dual merge system and an indexer triple merge system.
- Evaluation: The simulation of the indexer triple merge system demonstrated the highest consistency and coped well with the randomness of production floor operations.
- Implementation: The simulation, along with the calculated conveyor speeds, was shared with the equipment supplier for installation.
Commissioning a New Feed Mill
In this project, I was involved in various tasks such as documenting and regularly updating deficiencies in an open issues log, assisting in determining root causes of daily production issues, verifying changes to equipment, and checking and testing equipment capacities. I also tested grind and mash consistency and the micron levels of the ingredients, performed tests to measure the coefficient of variation on the mixer and the pellet durability index, and monitored feed demand across all South West region Feed Mills.
Further tasks included assisting with Open House preparations and presentations to government officials and the public, and designing a choke for the probe used to grab samples from the hammer mills to prevent air vacuum escape during sample extraction.
Flowvac Cryovac Dual Infeed Conveyors
The project aimed to eliminate product backup at the Flowvac's exit, removing the need for personnel at that location. I utilized a 5 Why's analysis and cycle time studies to identify the two primary root causes of the issue: Flowvac and Cryovac speeds not being synchronized, and inconsistent distances between products.
- Measurement: I measured the dimensions of the available space on the production floor, providing constraints for conveyor redesigns.
- Solution Development: I devised separate solutions for each root cause and used JavaScript coding to simulate the current condition and compare it with the proposed solutions.
- Presentation: I presented the solutions to the maintenance supervisor and the team, and we decided on the reprogramming of the PLC logic.
- Implementation: I designed and wrote a new logic for the PLC controlling the dual infeed conveyor. The PLC would use proximity sensors to monitor the empty spaces between products and only merge when sufficient space is available.
Ham Line Tumbler/Skinner Station
I improved the production efficiency of the ham line tumbler/skinner station by conducting thorough analysis and implementing significant modifications:
- Conducted a statistical analysis to determine that ham delivery to the tumbler was the main source of variation.
- Adjusted the angle of the ham tumbler in accordance with the equipment drawings, improving its purging capability.
- Identified the skinner station as the bottleneck through time study analysis.
- Determined the root cause of the bottleneck at the skinner station using a "5 Why's" analysis. The extended handling times introduced operator fatigue.
- Concluded that two skinner stations were insufficient for our new cut floor speed by comparing cycle times with the old production floor.
- Used AutoCad Inventor to redesign the skinner stations for improved product flow.
- Assisted in the redesign of the ham line by sharing my findings with the equipment supplier's design engineer.
Automation of Generating KPI Reports and Grain Capacities at Feed Mills
At Hylife, countless hours were spent gathering data about production performance, which was a huge non-added value task. To speed up and automate the process, I set up excel sheets with the capability to streamline data entry and save them in tables with the help of Macros.
I set up SQL queries that performed complex data calculations from different sources to automatically put together meaningful reports to track the Feed division performance. These reports included monitoring the micron levels of the ground ingredients, daily production performance in terms of tonnes per hour for the different processes in the Feed Mill, down times, tonnes ordered and delivered, and feed forecasting accuracy.
I used the ASABE S413 (Procedure for Establishing Volumetric Capacities of Cylindrical Grain Bins) to learn about the right factors to use to calculate accurate capacities of bins and the right compaction factor based on the type of bin and grain. I set up an excel sheet that is connected to the company's server (using SQL) to grab actual averages of our own daily tests for the received grains bushel weights to calculate the most accurate tonnes capacity from volume.
Rework Area Kaizen Event
I was part of a team that included process performers and supervisors from the rework area. The objective of the Kaizen event was to reduce rework processing time, improve organization, and reduce the workspace. The team took several steps to achieve these goals:
- Helped analyze the process through value stream mapping, identify possible root causes using a fishbone diagram, and brainstorm solutions/improvements.
- Plotted the solutions on a value vs effort graph to target the gems and the low hanging fruit categories.
- Created a detailed rework area current process flow along with cycle time for each step.
- Used the value stream map and cycle times to eliminate all non-value-added steps.
- Measured all dimensions of equipment and used AutoCad to create an accurate current layout of the rework area.
- Brainstormed different layouts of equipment and used spaghetti diagrams to show the most efficient layout.
- Implemented a new layout that reduced the space required to 41% of the previous layout and decreased the cycle time from 60 seconds to 40 seconds per box.
- Assisted the team in presenting the results to higher management.
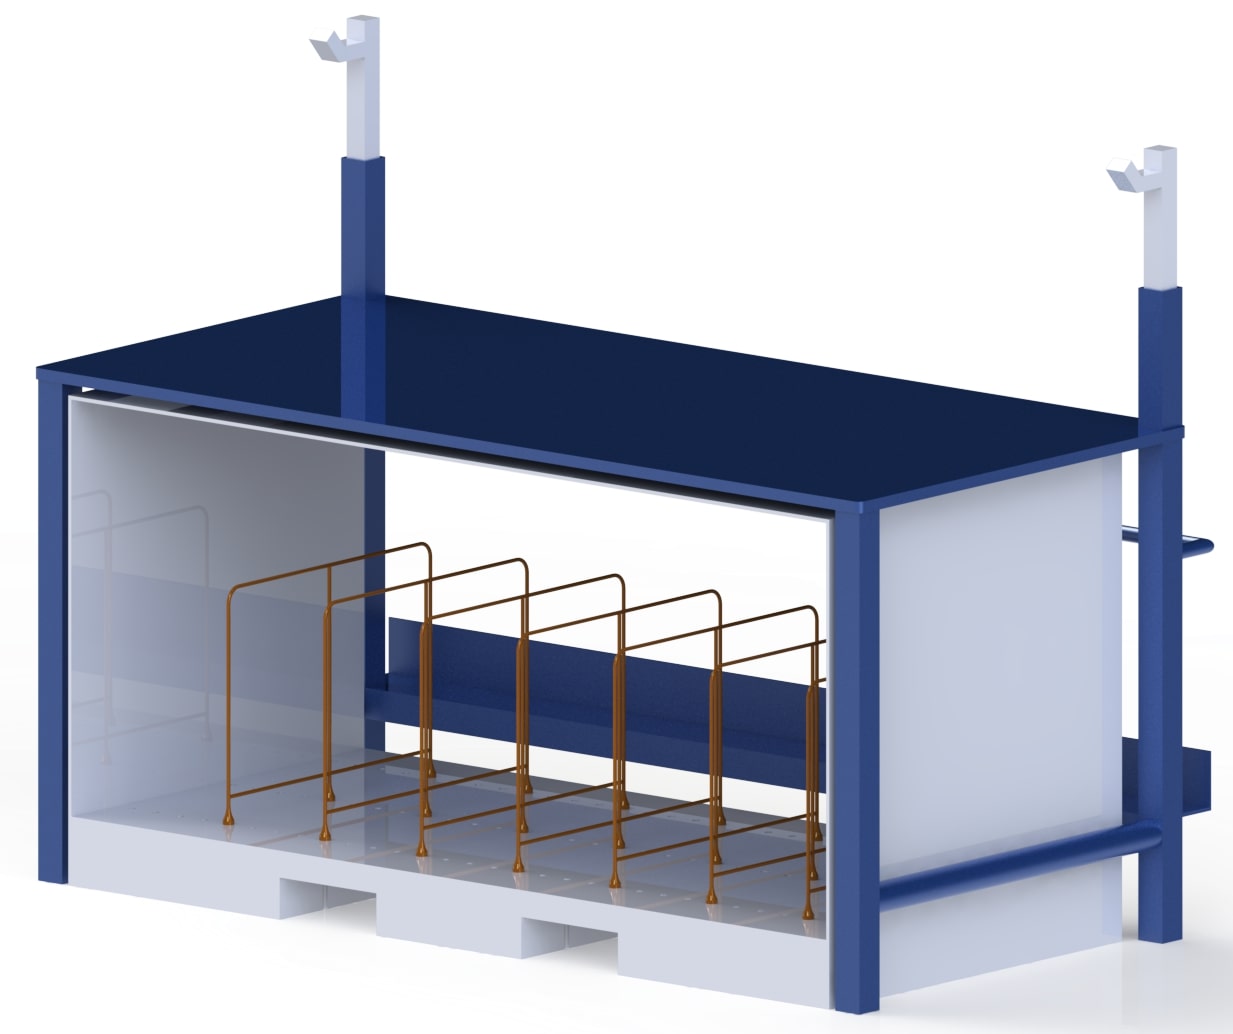
- Designed a new multi-purpose table using AutoCad Inventor to serve as a tabletop to process rework boxes, a box shelf that can hold up to 135 boxes, and a bag holding rack. The design was handed over to the maintenance team for fabrication.
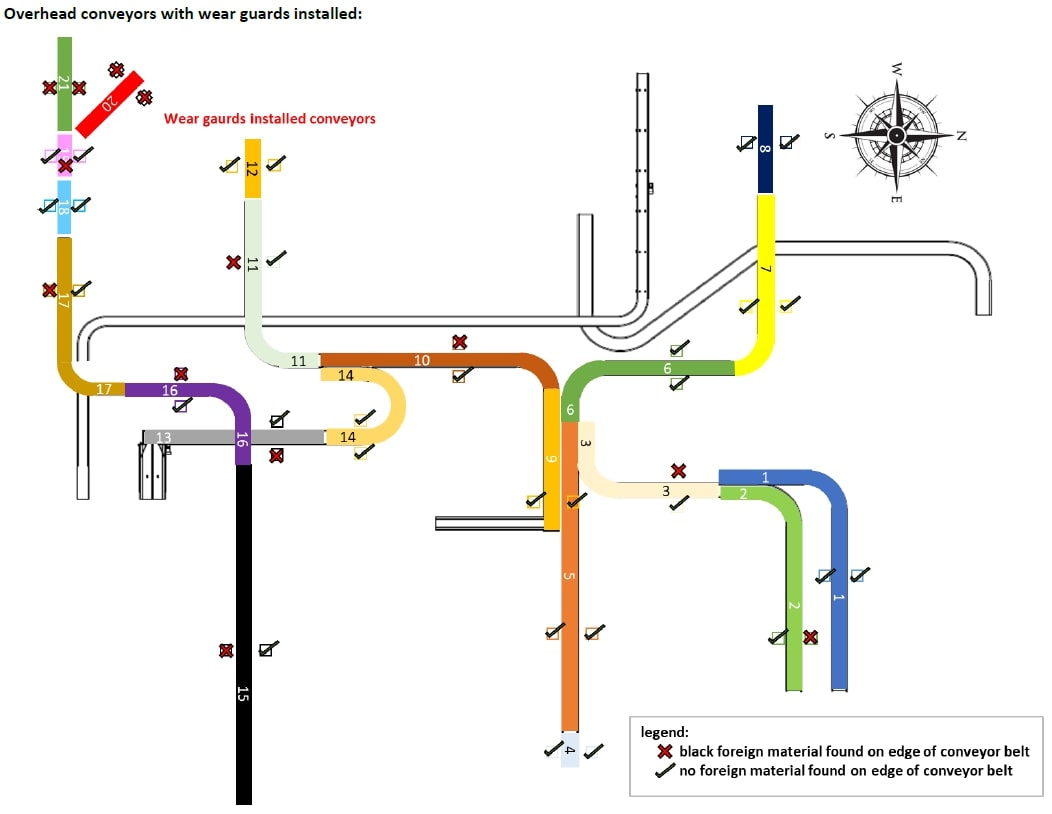
Overhead conveyors Wear Guards
The new conveyors on the cut floor were causing black foreign material that contaminated the products. In response to this issue, I measured all the lengths and dimensions of the affected conveyors to fabricate wear guards that would stop the belt from rubbing against the metal. I also worked with the sanitation team to identify another source of the foreign material, which was the long rollers spanning the width of the conveyors.
With the help of the maintenance and production team, I created a priority list for which conveyors to tackle first. I maintained contact with the contractor hired to install the wear guards and provided regular updates to the foreign material task force team. In addition, I audited the contractor's work and created an ongoing document to mark progress and deficiencies.
Floor Waste Reduction on Loin Line
One of my projects involved reducing waste on the loin line. Initially, I focused on a specific conveyor that was identified as causing high levels of floor waste. The first step was to measure the impact of this waste, which involved collecting and weighing waste over two days. The calculated average revealed a significant annual loss of around 16500 CAD.
Upon identifying the problem, I consulted with the maintenance team to brainstorm potential solutions. I also checked the loin line blueprints to understand why the conveyor was causing such high waste levels. It became evident that the conveyor was not designed for the product it was handling.
Eventually, I contacted the equipment supplier to discuss the issue. We decided to install a rotary scrapper for the conveyor. After getting the necessary approvals and purchase orders, the solution was implemented. This resulted in a significant reduction in waste and saved costs.
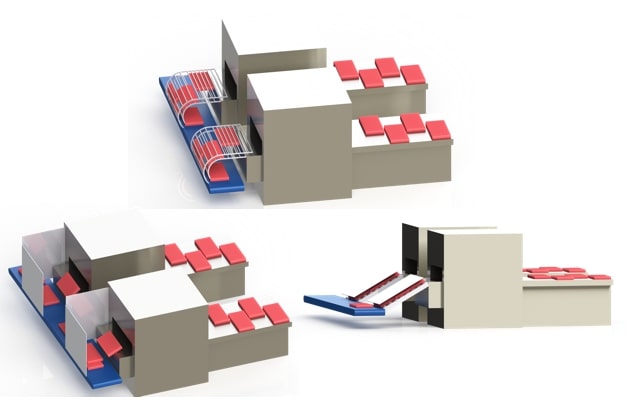
Supervac Simulation Project for Belly Line
The engineering team was assigned to design a new packaging area for the Belly Line using Supervac machines. I took on several key responsibilities to ensure the success of the project.
- Data Collection: I performed cycle times on bagger stations and Supervacs, and tested how many bellies our current Ham/Tenderloin Supervacs could accommodate.
- Simulation: I created a simulation of a two Supervac system using JavaScript coding, incorporating conveyor speeds, cycle times, and the capacities of Supervacs and bagger stations.
- Findings: The simulation indicated that at least five bagging stations would be necessary to maintain plant speed. It also revealed a potential issue with the take-away conveyors following the two Supervacs.
- Solution Design: I modelled three different solutions for the take-away conveyor system using SolidWorks and presented these to management.
OCM Ejection System Layout
I was assigned the task of incorporating an OCM rejection system into our project layout, with minimal modifications:
- Assessed the current system which lacked the capability to eject defects from the automatic box labelling machine in the shipping area.
- Devised a system to categorize all defects and direct them to their appropriate destinations on the production floor.
- Reviewed the layout of the shipping area and used space requirements to propose four different potential layouts using Autocad.
Trim Line Redesign
I played an essential role in the team that was tasked with redesigning the trim line on the new cut floor.
- Role Assignment: My responsibilities included calculating the required manning power and designing ergonomic worker stations.
- Data Collection: I performed cycle times on the current trim line and collected data on all the different products processed through the trim line.
- Calculation and Simulation: I collaborated with the shipping industrial engineer, using the product flow speeds and cycle times to calculate manning power. I simulated the timings of the different products flowing into the trim line using the production data.
- Validation: Using cycle times for each type of product and the number of manning required, I demonstrated that these parameters could meet the production demand.
- Design: I utilized SolidWorks to create various layouts for the trim line worker stations to enhance ergonomics, which I then presented to the production team.
Freezer Requirement For Chinese Products
Our task was to find an efficient solution for reducing our products' internal temperature to -18 degrees Celsius within 48 hours. Upon analysis, it was clear that our main freezer lacked the required capacity to reach these target conditions, and we needed to implement an alternative freezing solution.
We researched various industry solutions, including blast freezers, cryogenic, and contact freezers, listing the advantages and disadvantages of each solution. After thorough consideration, the plate freezers emerged as the best option for our plant needs.
We consulted with thermodynamics literature and used Pham's method to calculate the required time to reach the target temperature. The method showed that we could drop the temperature from 2 degrees Celsius to -18 within just 13.3 hours.
Taking into account the maximum amount of Chinese products produced daily and the sizes of the boxes of these products, we calculated the required dimensions of the plate freezer. Our findings were reported to the continuous improvement manager, who then presented them to the executive committee. The project has now been approved and is in the equipment sourcing phase.
Commissioning The Thermoformer
As part of the team commissioning the Thermoformer for full-time production, I worked on a multitude of tasks. This included creating a task list and an updated Gantt Chart to keep the project on track, writing test protocols to trial different parameters for the products processed by the Thermoformer, and assisting in organizing and performing tests. The results of these tests were used to calculate the Thermoformer's capacity and required manning.
In addition to these responsibilities, I also assisted in choosing the correct boxes for packaging the Thermoformer-produced packages, creating an SOP for the machine, and deciphering daily error codes. I also worked on modifying the conveyor for a storage area for incoming products and updating the production team on test results.
Indexer Designs
I was a part of a team tasked with redesigning the gam indexer across the entire plant, as the existing ones were identified as a major source of foreign material.
- Concept Development: I came up with two different principles and used AutoCAD Inventor to create multiple concepts for each principle.
- Animation: I used Inventor Studio to animate the indexer to illustrate the movement of the gams.
- Presentation: The generated concepts were presented to management, and one concept was chosen for creating a test rig.
5S Event for Maintenance Shop at a Feed Mill
I was privileged to introduce the 5S concept to a Feed Mill Maintenance Team. In a comprehensive presentation, I explained the principles of this methodology and how it could be applied to improve the organization of their maintenance shop.
The team was engaged and eager to apply the methodology, and we embarked on the process together. The sorting phase was challenging as it required us to decide on the necessity of each item in the shop, and categorize them accordingly. We used a value versus effort graph to prioritize our actions and manage our efforts effectively.
Documenting the entire process was an important part of our work. We took care to capture the state of the shop before and after the application of 5S principles. The transformation was significant and led to improved efficiency in the shop. We also compiled a report for the mill management and shared the lessons we learned through the process.
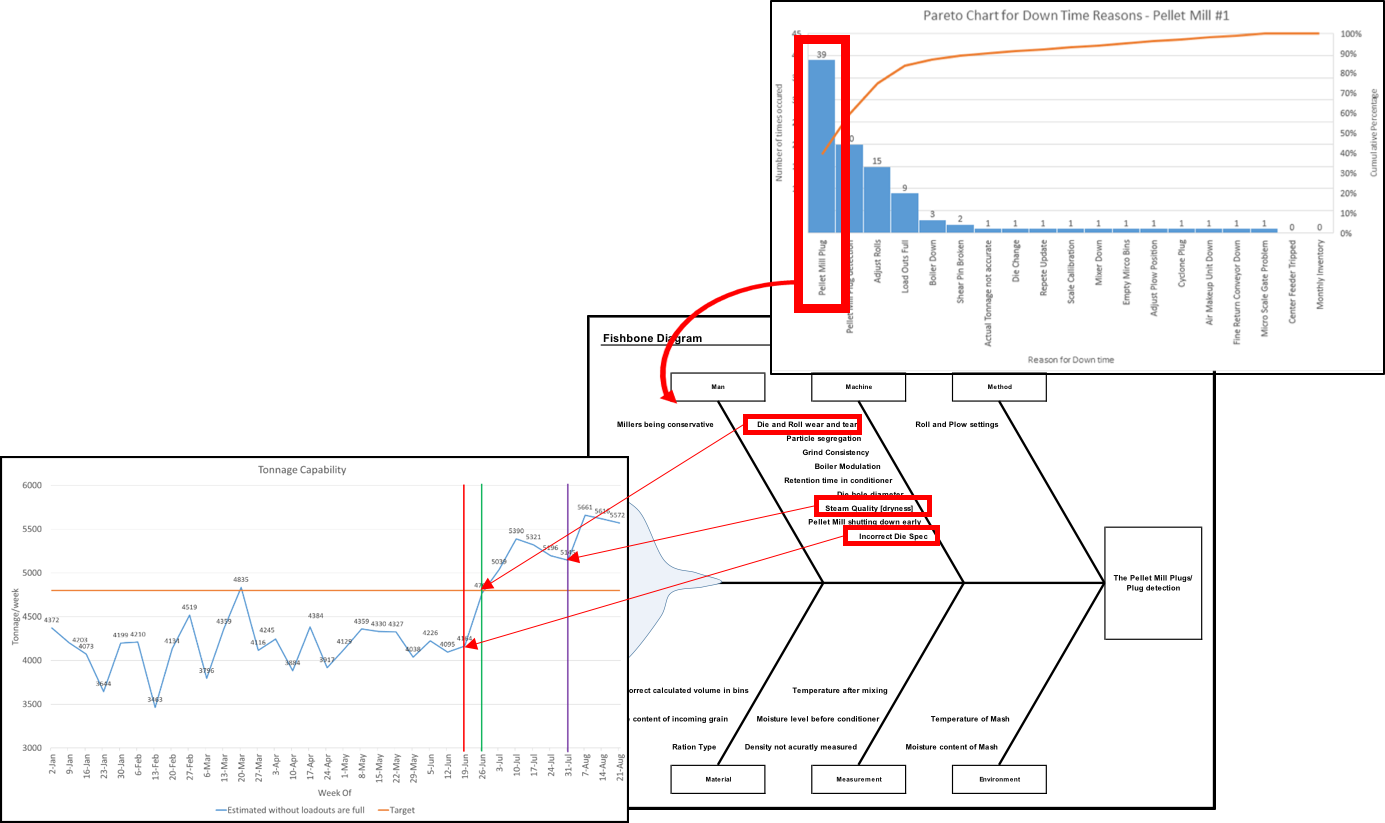
Feed Mill Pelleting Improvement
Our Feed Mill was initially designed to produce 4800 Tonnes/week, which is equivalent to 250KT per year. However, the baseline production before the commencement of this project was 4300 Tonnes/week, a performance lag attributed to downtime, specifically due to pellet Mill plugging.
Through dedicated efforts, we managed to increase the production capacity to 5600 Tonnes/week or 290KT per year. This improvement of 30% was a significant achievement. Our efforts also led to a decrease in the average plugs per week, from 12 to just 1.3, reducing overtime hours and saving $680K per year.
Batching Downtime Improvement
The Randolph Feed Mill is capable of producing feed at a rate of 52 tonnes per hour. The process begins with mixing the ingredients in a process known as batching, before the feed proceeds to the main process, pelleting. By design, the batching process is meant to have an average output of 60 tonnes per hour.
To optimize the process, we performed the 8 steps of process understanding which include identifying process owners and stakeholders, defining process purpose and output, understanding customer needs, measuring process performance and establishing a baseline, and identifying sources of variation. A detailed linear process flowchart was created for every step in the feed-making process, and time studies were conducted.
Note: This section is still under construction.
Hog Stress Effect on Meat Quality
Under Construction.
MODA Equipment Commissioning
Under construction.
packaging manufacturing Engineer
Under construction.